Executive reporting dashboard
Product design, design system, data visualization, AI use case, user research
Project Summary
The Quick Service Restaurant (QSR) serves more than 70 million customers daily across 39,000 locations in over 100 markets. Despite this scale, executives relied on multiple reports that took weeks to manually compile.
Our goal was to create a single source of truth that c-suite executives and market leaders could depend on to analyze business performance.
The resulting source of truth dashboard unlocked two key wins for executives: real-time access to performance data, rather than waiting on the QBR cycle, and QBR prep itself — once hours of manual work for executives and their direct reports — reduced to a single export.
Highlights
- Reduced Quarterly Business Review (QBR) preparation by 70%
- Reduced KPI reporting delays from months to 2 days
- Ranked 1st out of 29 projects in Accenture's Midwest Innovation Challenge
- Established the company's first internal data visualization patterns
Discovery
Constraints
Designing for executive leadership came with unique challenges: limited access to users, constantly evolving KPIs, and multiple data sources with different refresh schedules. Research also showed executives primarily used tablets, making a tablet-first experience essential.
Proxy research
Because executive interviews were limited, we began with direct reports who prepared leadership reporting, then used those insights to focus our executive sessions. We also audited existing reports to understand workflows, pain points, and how leaders consumed information.
What we found
Executives valued seeing the real numbers themselves, not an interpretation of them. What mattered most was confidence in accuracy, so they could apply the data to whatever question was in front of them at the time. Sometimes the high-level KPIs were all they needed; other times, they needed a more detailed breakdown of the metrics behind them. We found they leaned on specific aggregations, like top 10 markets, to support their analysis.
We also discovered that while the company had a mature customer-facing design system, there were not yet any UI standards for internal tools or data visualization.
Detailed Design
Designing for executives
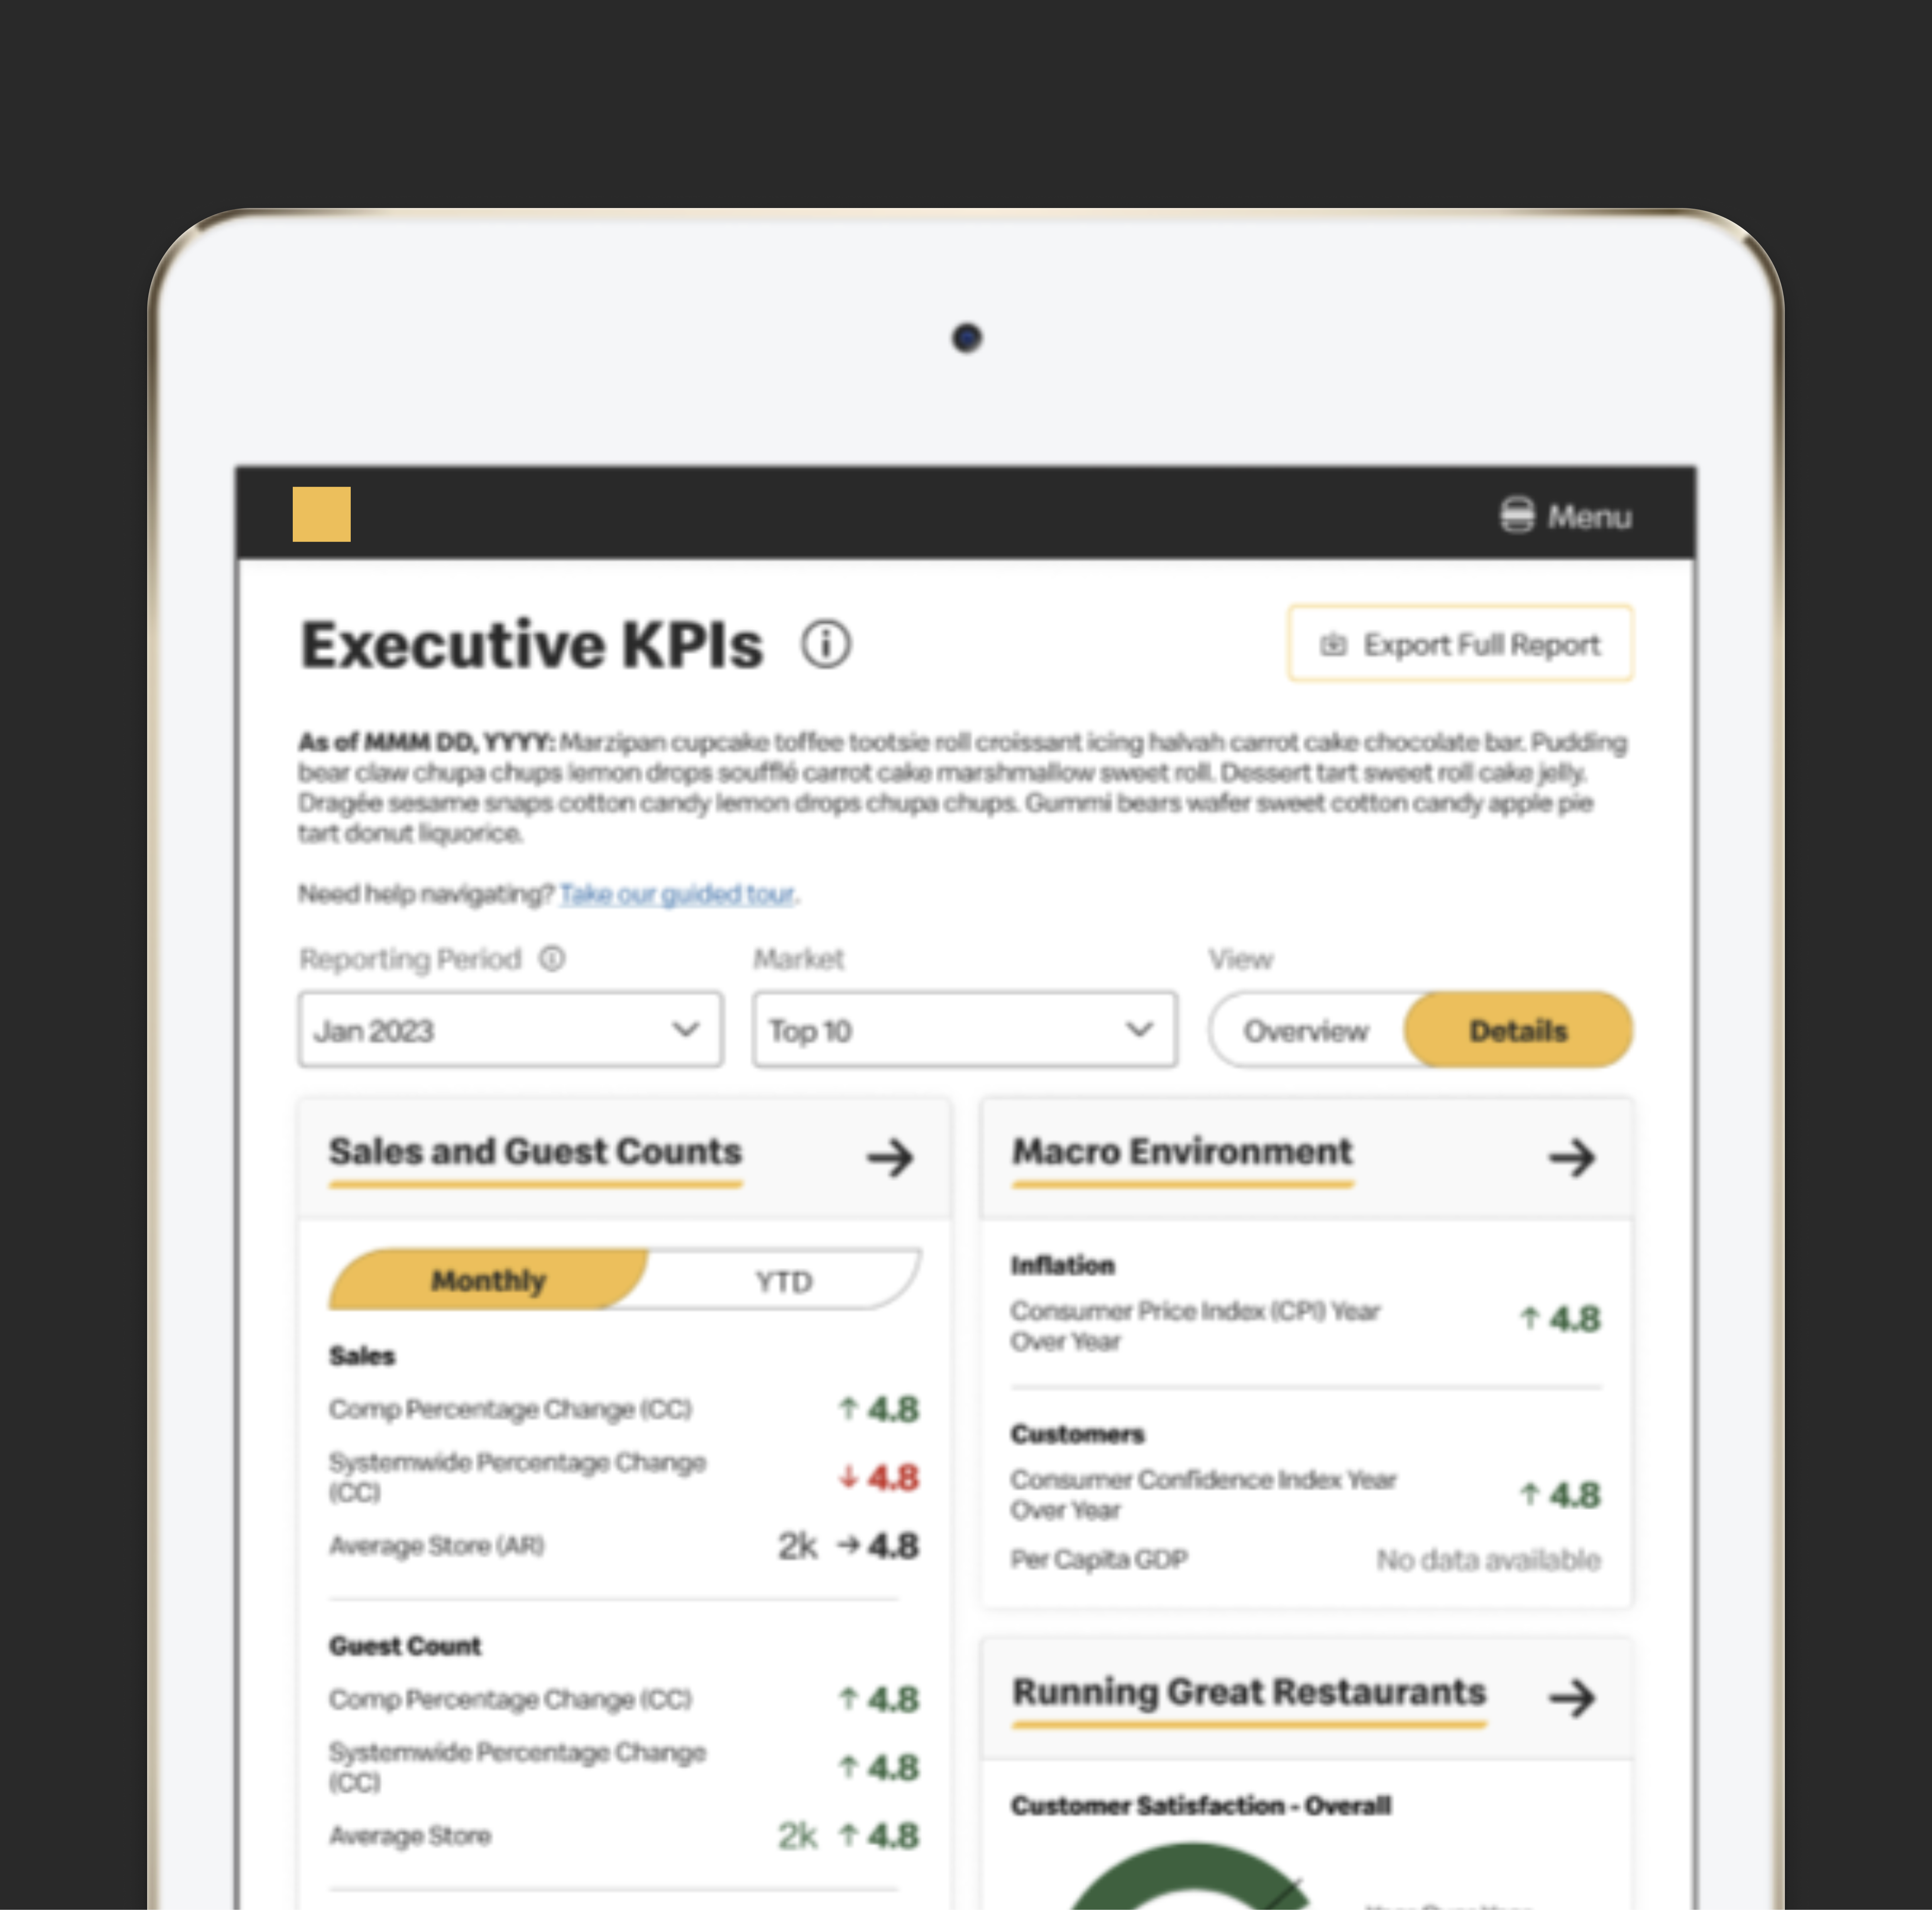
We organized the experience into three levels of detail: an executive summary, visual breakdowns of each KPI, and the ability to download source data.
The executive summary gave leaders the whole picture of the business at a glance, across every KPI. Each KPI breakdown showed performance over time, with filters to adjust the view. And to keep that confidence intact at every level, we surfaced the last-updated timestamp and active filters alongside each visualization — so it was always clear exactly what they were looking at: this data, as of this date, at this frequency, in this market.
Links to source data added one more layer of reassurance, and gave the few executives who wanted to work directly with the raw numbers a way to do that too.
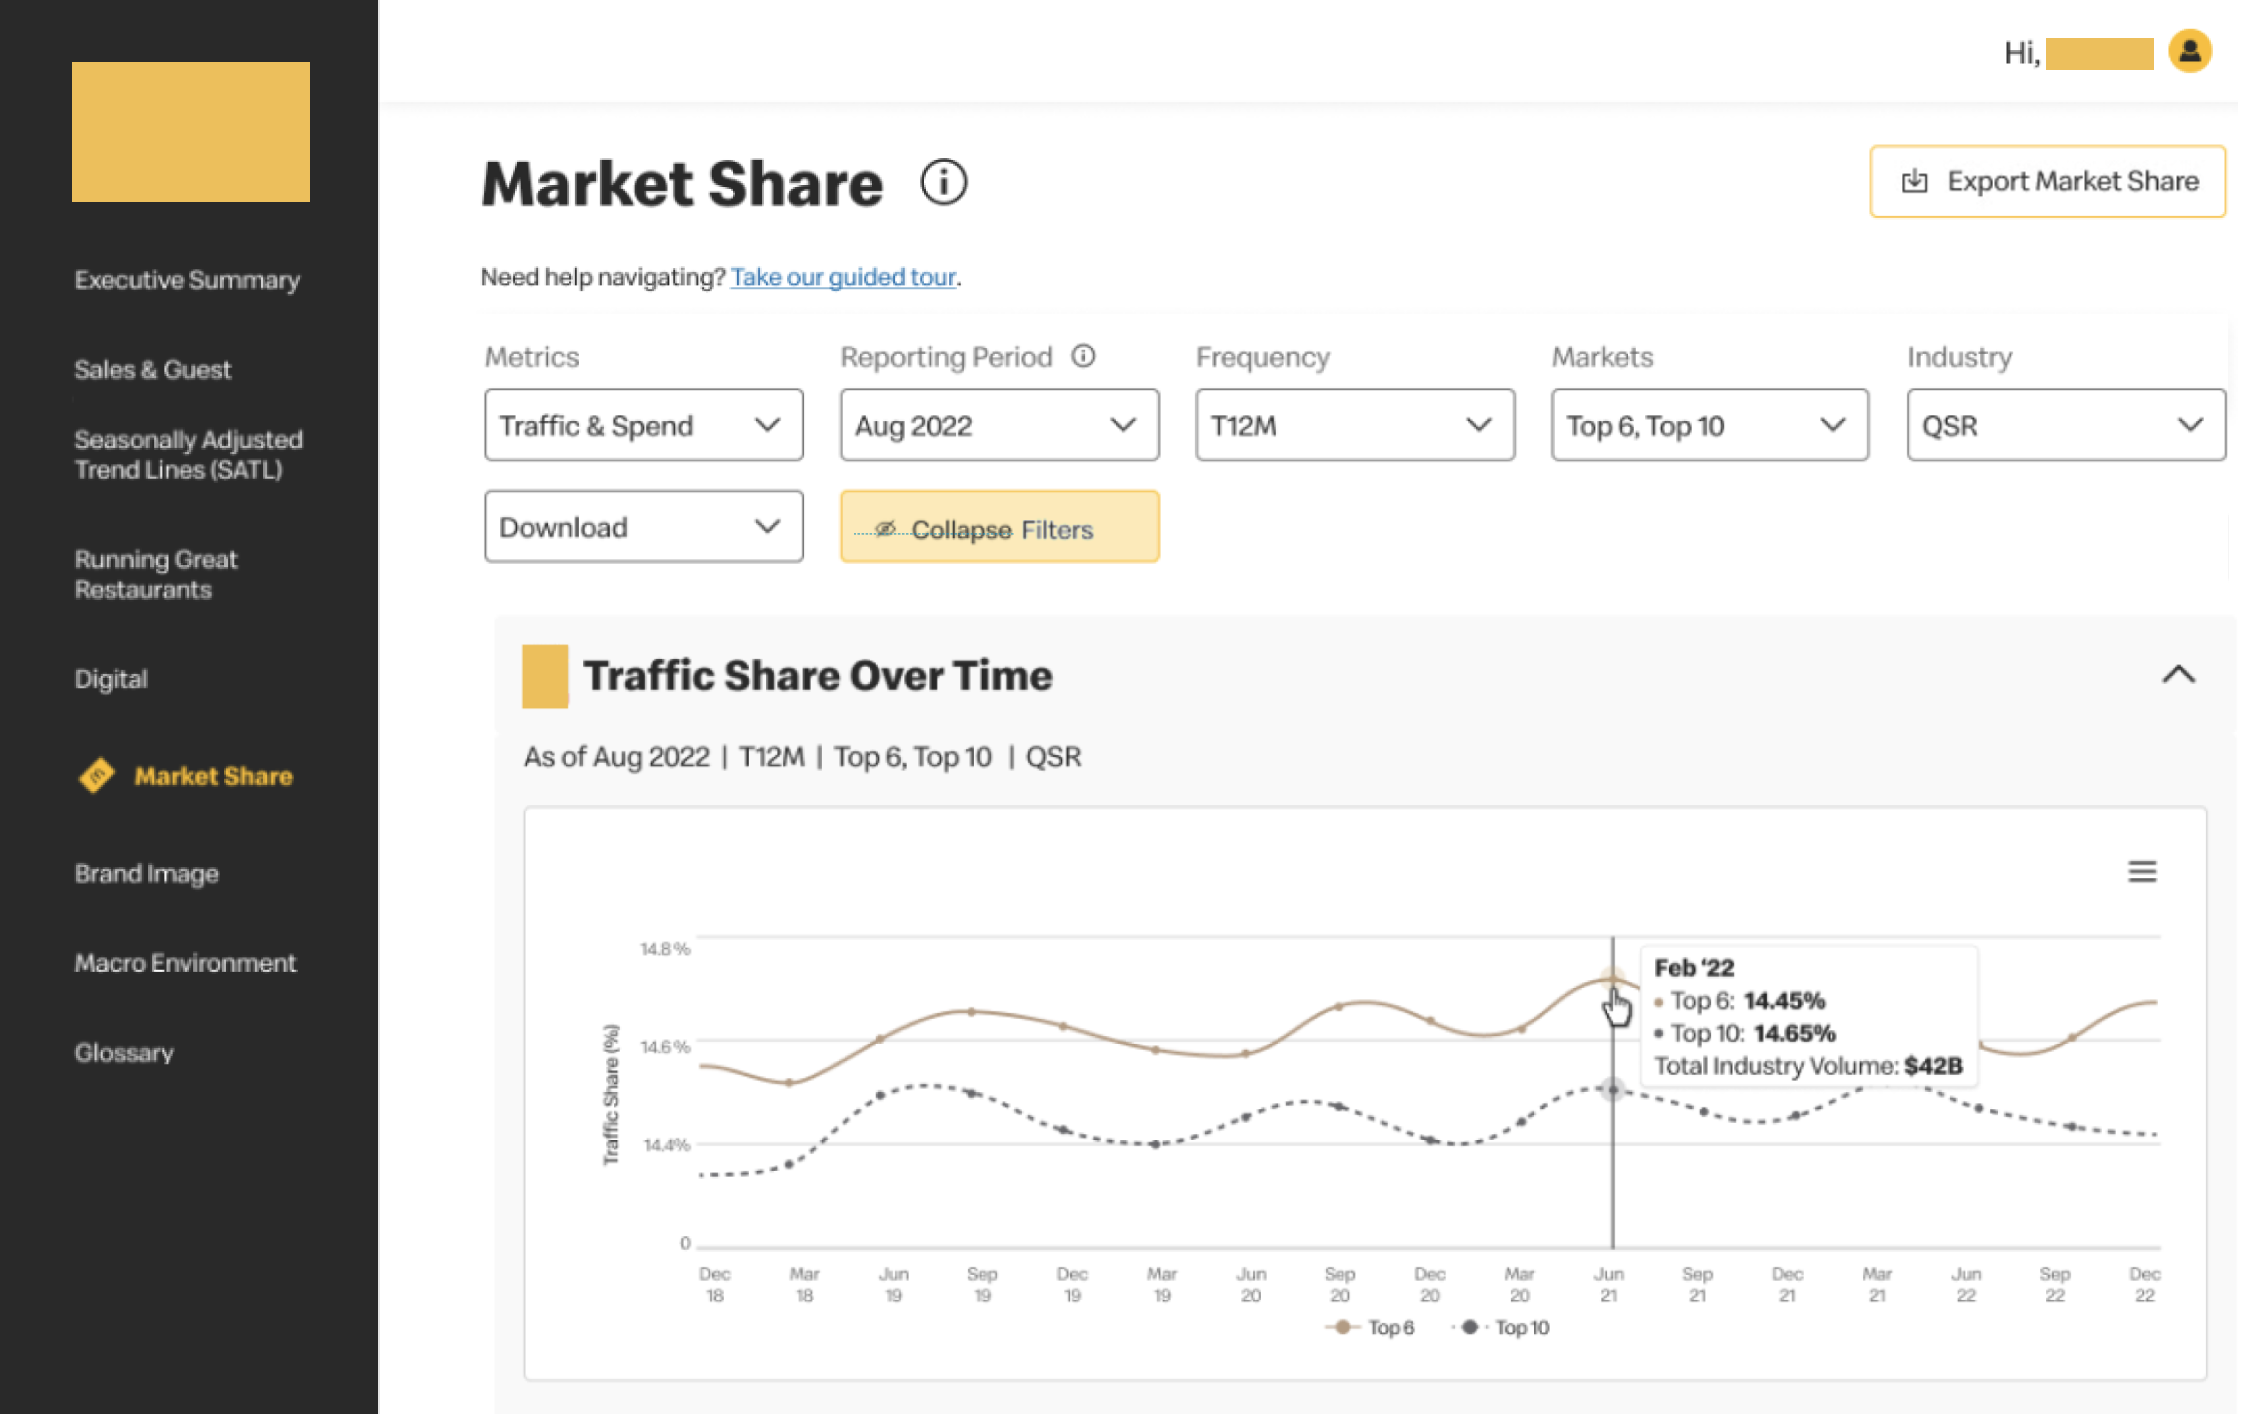
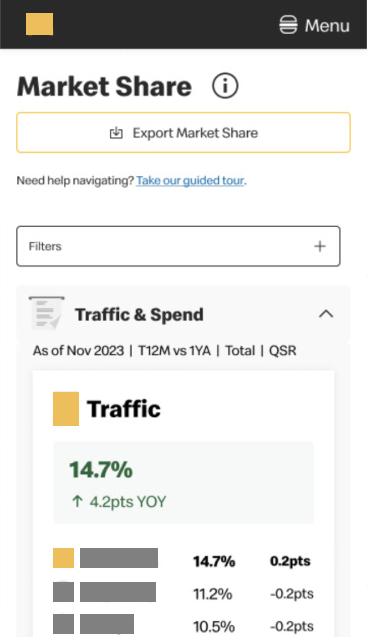
KPI breakdown page
Identifying an AI use case
While executives wanted to be able to interpret the data themselves, they also liked the idea of a headline — a sentence or two they could quickly check each morning to get an idea of what's changed. This was a great opportunity for an AI-generated summary. Although it ultimately fell outside the project's scope, stakeholders saved the concept for future releases.
Expanding the design system
Rather than designing one dashboard, I created a scalable foundation for future internal products. I built an atomic Figma component library with reusable data visualization patterns, accessibility guidance aligned to WCAG AA standards, and standardized usage documentation to help future teams extend the system consistently. These patterns are now used across multiple internal tooling teams.
Delivery
In the end, we not only delivered the designs but also a design library and backlog of future enhancement concepts. And the impact was real; the 70% reduction in QBR prep and the jump from months to two days in reporting delays weren't wins in efficiency — they changed how leadership made decisions, day to day instead of quarter to quarter.